Gear change map

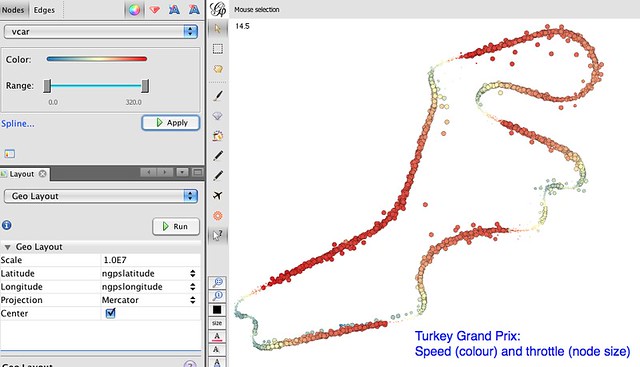
Speed and Throttle map

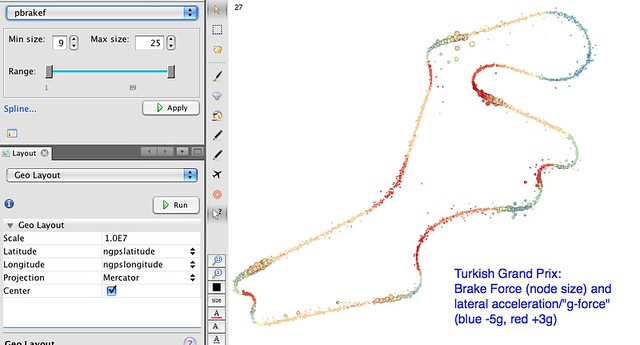
SBrkae force and lateral acceleration map

For more on what data I have available: F1 Data Junkie – Looking at What’s There
If you have any ideas for what might make interesting data pairings using visualisations of the above sort (blob size and colour dimensions), based on the available data, please let me know in the comments...
I have some experience handling data as part of some of my previous positions as data analyst for the Quality organization on my company.
ReplyDeleteI think that one of the intriguing correlations that should be explore is the famous tire management that everyone is talking about. I'm not sure what data is available to correlate the speed around the track in order to point out the degradation of the tires. For example, there are some comments that after Hamilton changing tires on one of his stops, he degrade them too much on his first turn after going to turn 8. Is this visible on the data? Did he slow down after this? Pairing speed, gear changes, and throttle around this pit stop should reflect a change on driving behavior.
Also, there is a clear strategy to be learn on how to keep fresh tires versus used. Prime example, Webber versus Alonso. They were very close until Webber had a fresh set to use at the end. However, is there data available that can tell us how old were Alonso tires? What is the average life on them? I believe this could be discovered if it's possible to know when they are changing sets during Saturday practice and qualification.
Finally, DRS and KERS should also be possible to visualize. A focus analysis on the DRS section should show their performace. Can we discover when KERS was use around the track?
I'm willing to take a look at some of this data and see if we can get some conclusions. Could you share some of the raw files?
@Armando The McLaren data includes an sLap measure, the distance round the track, that I was going to use to create a rough time-to-distance-to-GPS lookup chart. Also in mind is looking at classification/machine learning techniques to see if I can segment the data into separate sectors, possibly quite small ones, relating to different areas of the track.
ReplyDeleteI'm not sure how we'd look for signs of tyre wear having occurred on eg turn 8?
As far as tyres go, I intend to starting looking at race timesheet data segmented by stint and tyre to see whether or not the different tyre types have an identifiable signature (with a known degree of certainty) based purely on laptime data taken across the cars and across the sessions.