Complementing
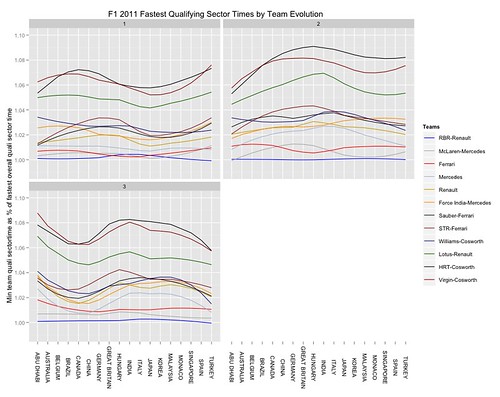
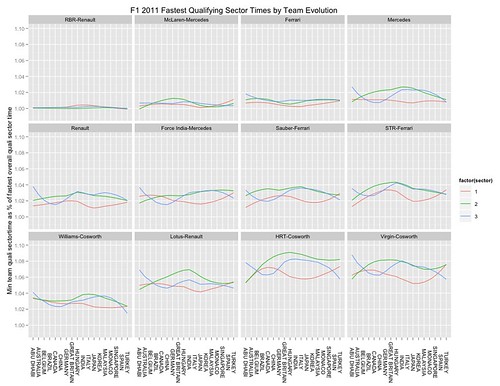
F1 2011 Review - Qualifying Sector Times, in which I plotted LOESS fitted curves to the qualifying times of both drivers in a team across the 2011 Formula One season races, here are a couple of charts that plot fitted curves against the best time recorded by each team for each sector in each race.
Firstly, a breakdown by sector:

Secondly, a breakdown by team:

I've updated the
R-code gist if you want to try it out yourself.


No comments:
Post a Comment
There seem to be a few issues with posting comments. I think you need to preview your comment before you can submit it... Any problems, send me a message on twitter: @psychemedia