Trend lines are interesting. Are they related to performance upgrade package timing (maybe of leading car...) or are they due to track characteristics? I guess the next step would be to decide how we can differentiate between possible explanations.
As a first pass attempt at this, using the data available here, I wonder if we can use sector times to try to distinguish between track dependent improvements and car dependent improvements?
To do this properly, I guess we need to be able to categorise each sector of each track according to one of a limited set of factors that describe the characteristics of each sector, and then map sector times normalised with respect to overall fastest sector times (I wonder if it would also make sense to take into account variance/standard deviation of times across races/sectors too, and control for those? Eg rather than plotting the normalised time relative to fastest time, relating it to sd or some other measure of spread?)
Anyway, as a step towards that (does anyone have a categorisation of track sectors I could play with? If so, add a link in the comments:-) here are a couple of charts relating to the evolution of normalised sector times by team across the season.
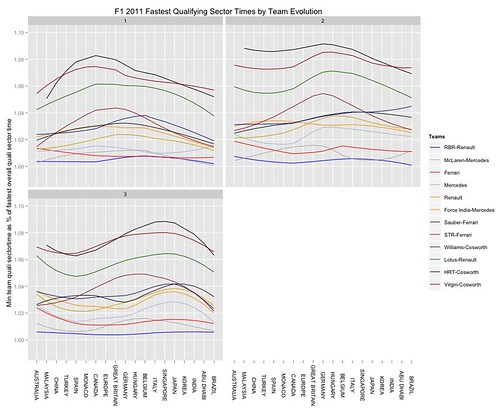
First up, times by sector by team:

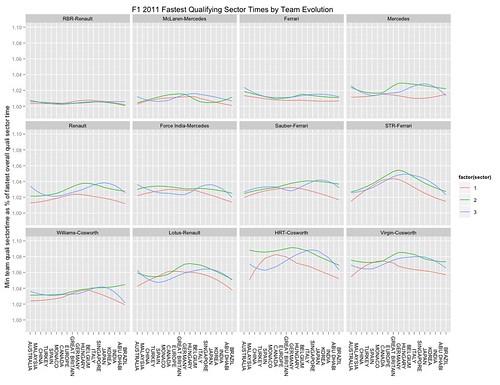
And here's sector time evolution by team:

I guess what both these charts show is that the relative performance changes from race to race across sectors do not necessarily correlate with each other. If we could categorise each sector for each track in a way that relates to dominant track features for the corresponding sector that might effect car performance, we might get a better idea of whether car updates or track features are influencing performance?
For the F1 sports journalist, might the charts hint towards any particular lines of investigation?
If you want to tinker yourself, here's the R code I used to generate the above charts from source data on Google spreadsheets (I run the code in R-Studio):
Bah... I also meant to generate and post the curves for the best times within a team as well as best fit lines relative to times from both drivers in a team... Ho hum... I guess that'll do for another post...
ReplyDelete