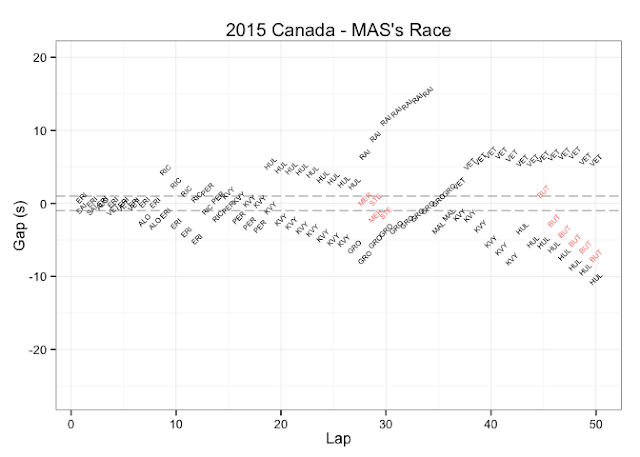
Battlemaps (or battle charts, I keep flitting between the two) are akin to cut down race history charts from a particular driver's point of viewing, showing the distance to the car's immediately ahead and behind in terms of position, and on track.
Here's a selection of battlemaps for some of the drivers for the 2015 F1 Canadian Grand Prix.
First up, Bottas' race: during the first stint he left Grosjean behind, and slowly lost ground to Raikkonen, but it looks as if Raikkonen lost out during the first pit stop and then presumably stopped for a second time. (Did Bottas only one stop? I need to make this clear in the chart somehow....) In the last fifth of the race, Rosberg just marched off into the distance ahead.
Here's how it looked from Raikkonen's perspective:
In the first stint, Rosberg eased ahead, and Bottas slipped behind. In the second stint, Bottas grabbed the advantage and held it steady. In the third stint, Raikkonen made gains on Bottas following the second stop but not enough to pose any real threat. In the second and third stints there was no real competition from behind.
With Bottas competing strongly, how did teammate Massa fare? The first 10 laps were nip and tuck with DRS battles ahead and behind. Massa got past Ericsson and cleared Ricciardo, Perez, and Kvyat in quick succession, then took chase after Hulkenberg. Something happened (pit stops?) around lap 28, and Massa was left for dust by Raikkonen as Grosjean came storming up behind him, and then passed him. Was there a second stop for Massa about lap 36? He's lagging Vettel and not making any progress ahead, but threats behind are now all diminishing right to the end of the race.
So what happened to Grosjean? Left behind by Bottas in the first stint, Grosjean did the same to Hulkenberg behind. From about lap 25, the situation changes (first stop?) and Grosjean charges down Massa. He can't make progress on Raikkonen either before or after Raikkonen's second stop, but manages to keep Maldonado a safe distance behind. Is there then a second pit stop right at the end of the race?
Going in to the weekend, Ferrari had been hopeful of a strong showing, but with a start from the tail end of the grid, Vettel had his work cut out for him. Quickly picking off Nasr, Sainz and Alonso, and I'm guessing an early pit stop given he had to pick off Nasr again (although easily achieved), Vettel appeared to get stuck behind Maldonado and then Grosjean before getting chasing down Hulkenberg, though he seems to have struggled making the pass (before Hulkenberg lost at least a couple of places?), and then Maldonado, though time ran out on him before he get within striking distance of that extra place.
Finally, let's see how Max Verstappen fared. Despite a battle with Nasr ahead in the first stint, Merhi was left well behind. having cleared Nasr, his superior pace showing as Nasr tailed off behind, Verstappen took on Alonso, passing him in seven laps and setting his sights on Sainz. From about lap 28, Verstappen is losing ground on Hulkenberg ahead, and to Kvyat threatening behind, and then Perez. Meeting up with Alonso again, he's lapped by Bottas, and encounters backmarkers Merhi and (later) Stevens, before passing Alonso for a second time. Despite making small gains on Ericsson, he's to far behind to make much further progress, but at least he's safe from Nasr behind, who only goes backwards.
So, that's my reading of those charts. What they do show is that to make more sense of them we need the race positions and pit information available, ideally somewhere on the chart? But they are still useful I think? (For what it's worth, I haven't seen the race yet, or read any reports of it. the above descriptions are based solely on the readings of the individual charts.)


Trying to avoid spoilering you, but the only thing you're not picking up from the Bottas/Raikkonen data probably couldn't be shown using this diagram.
ReplyDeleteDo tell... :-) Not sure when - if ever - I'll get to actually see the race...
DeleteBasically Raikkonen came in for tires, and the pitstop went fine, but about halfway through the outlap Kimi did a 360 spin out of nowhere, losing him time. Hence why I didn't think it could show up in this kind of diagram.
DeleteAh - no, there's no way that would show up on these particular charts. There may be a way to spot unusually long outlaps (perhaps indicative of an outlap incident) by factoring time in pits into the laptime data - looking at this is on my to do list (though my original inspiration for this was to try to identify situations where folk pass each other in the pits).
Delete